
KNEE3D
Next-level knee joint imaging
Computed tomography (CT) for 3D visualisation
Rather than using x-ray radiography, we believe that CT holds the key to next-level assessment of structural knee joint disease. CT can depict the knee in any plane as well as provide far superior 3D visualisations compared to x-ray ...


3D feature mapping
Our analyses build 3D models from CT imaging data
Using techniques such as cortical bone mapping, joint space mapping and statistical shape modelling, we are able visualise structural disease at the knee joint with robust precision and accuracy and at multiple timepoints on a common surface.


3D joint space width from Weight Bearing CT
See beyond the limit of 2D x-ray radiography with Weight Bearing CT (WBCT)
Visualise the joint space in 3D from WBCT to avoid data loss and non-physiological measurements. Read more about our members' groundbreaking research from 2021 in the world-leading Radiology journal here, including the editorial by international osteoarthritis imaging expert from University of Erlangen-Nuremberg, Germany, Prof. Frank Roemer.
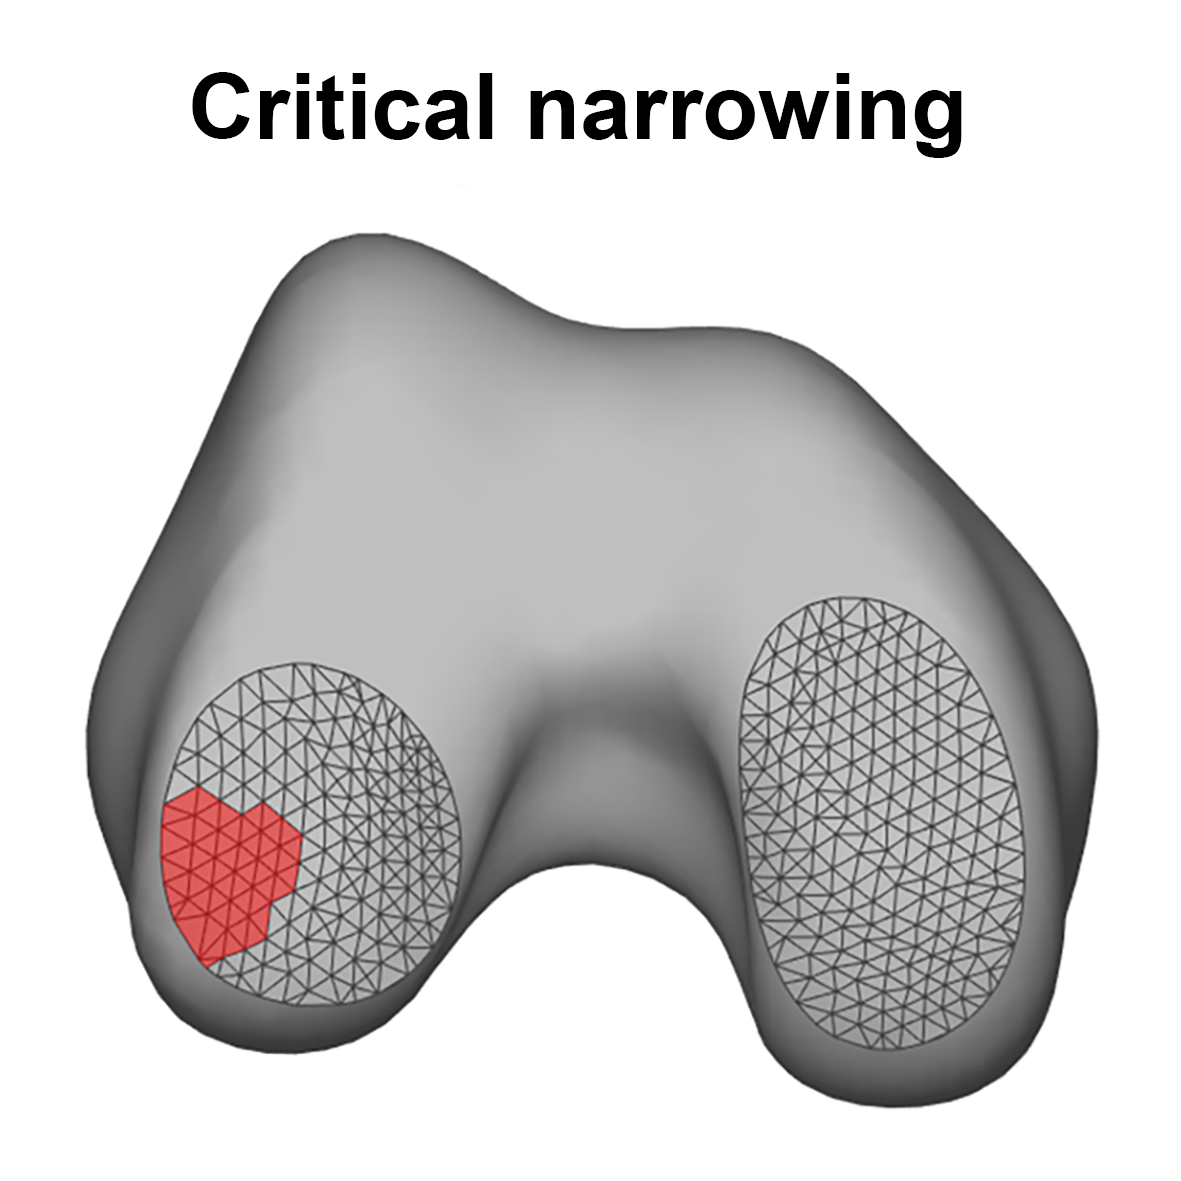
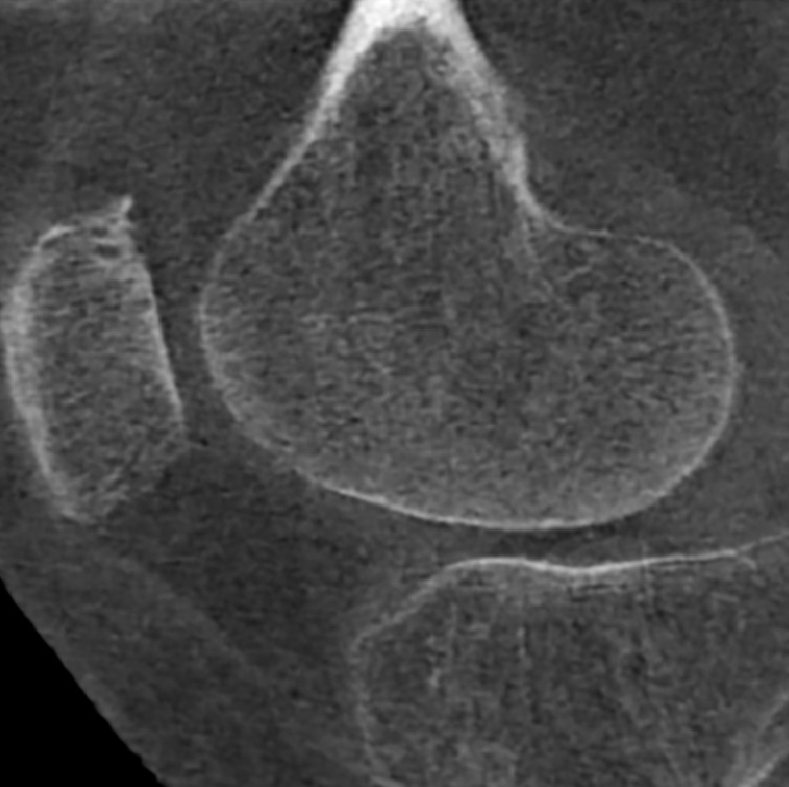
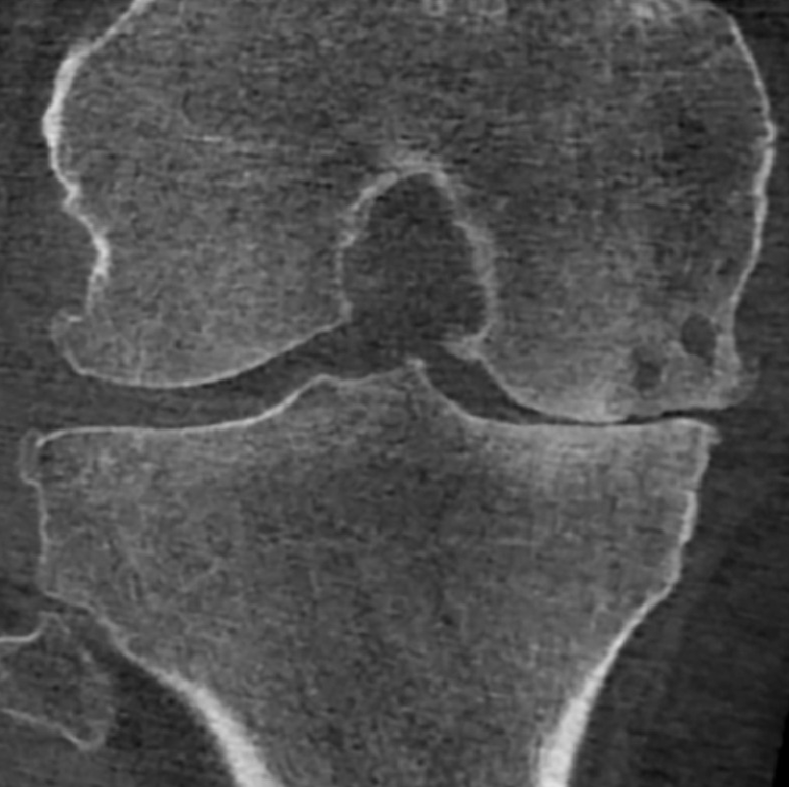
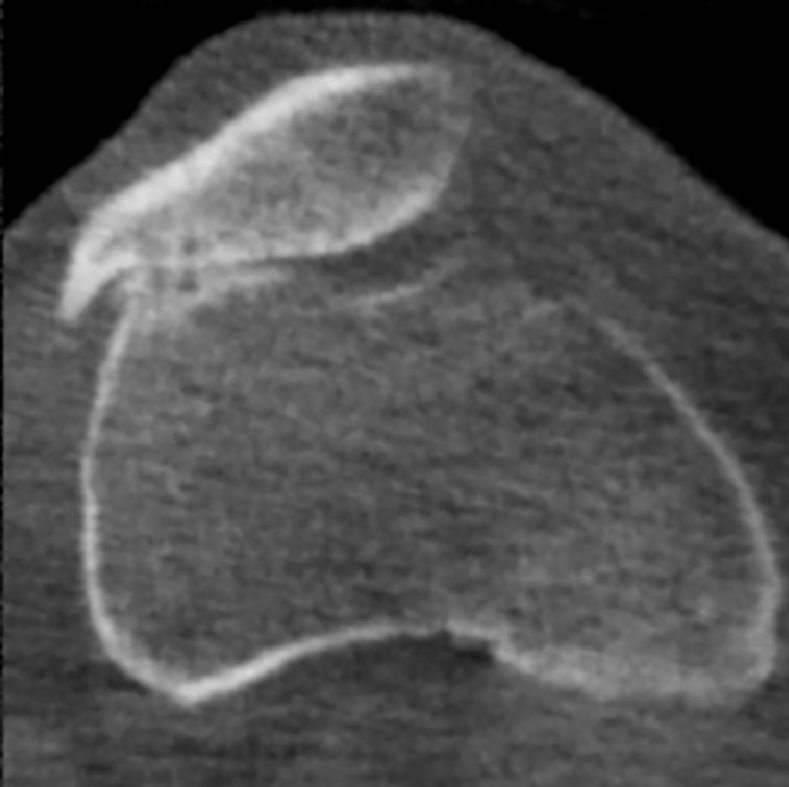
Imaging examples are of medial joint space loss (panel 1), joint space mapped in 3D in an inferior view of the right knee (panel 2), and a separate case where the lateral tibiofemoral compartment joint space critically narrowed after a 2 year interval (RED, panel 3).
This paper also demonstrated that joint space mapping has a test-retest smallest detectable difference of down to ±0.1 mm in the central medial tibiofemoral joint space for individuals without radiographically demonstrated disease, which is at least twice better in performance than that of radiographic minimum joint space width measurement.


COAKS
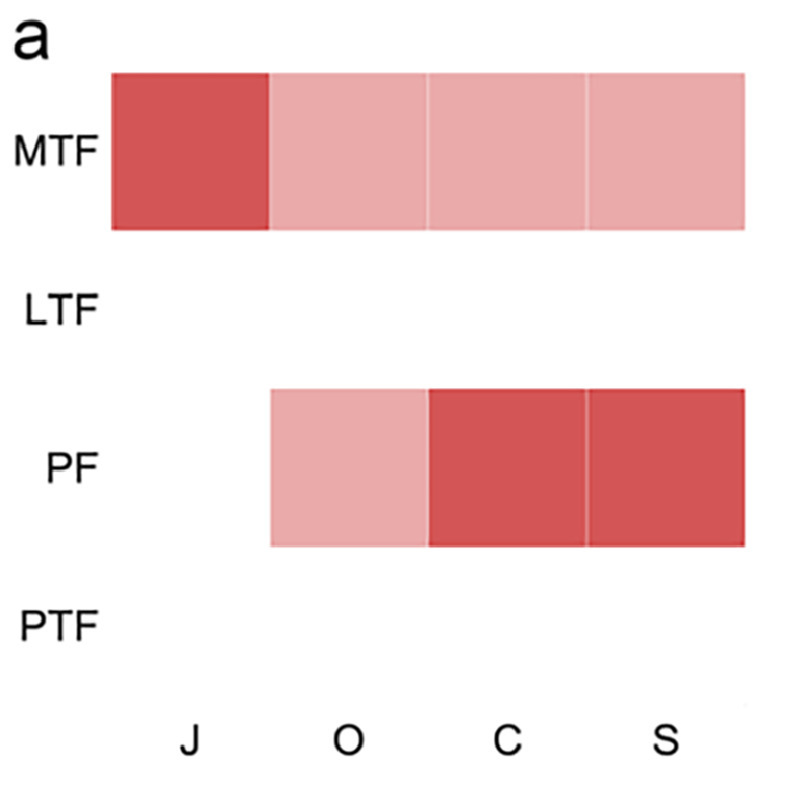
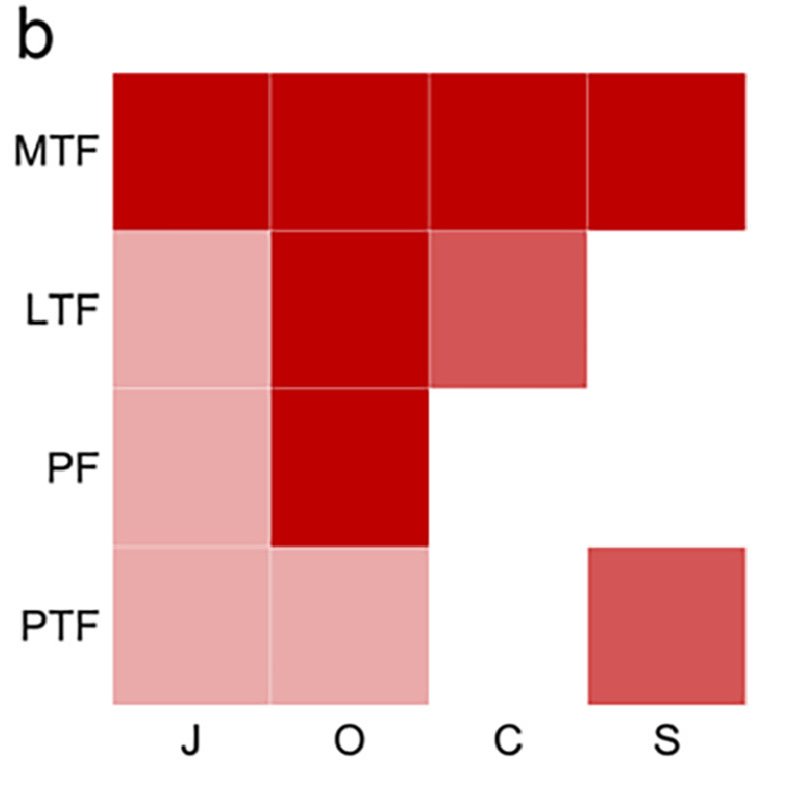
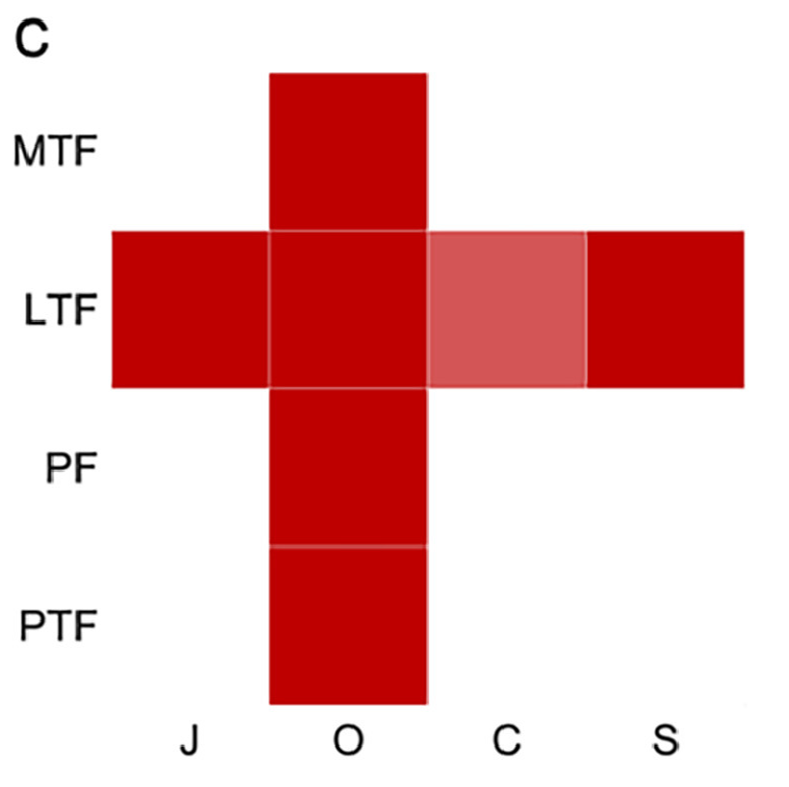
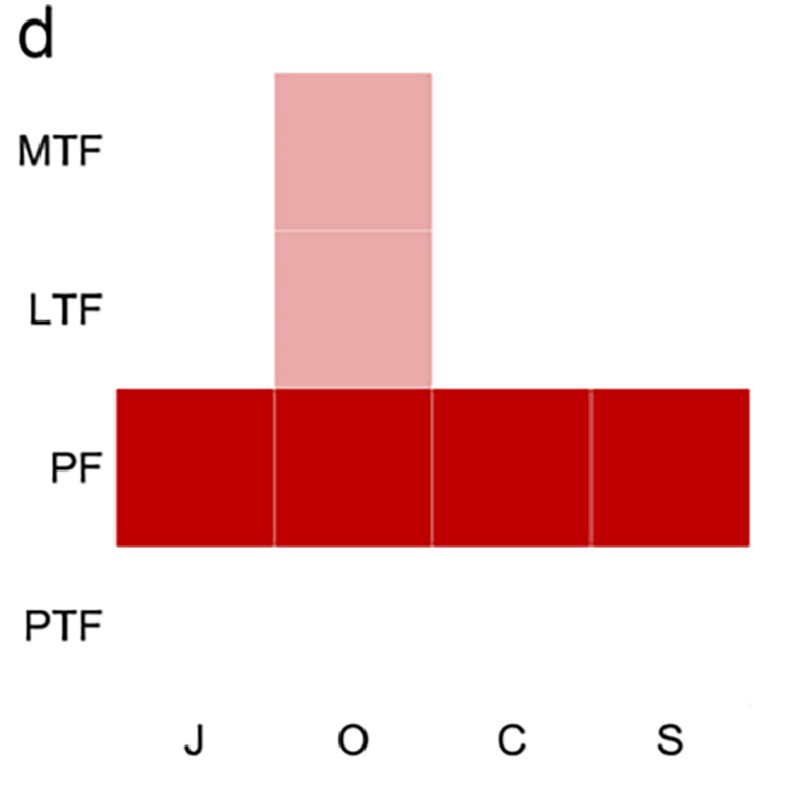
Members of our team were creators of the semiquantitative CT Osteoarthritis Knee Score (COAKS), which assesses four different knee compartments: MTF = medial tibiofemoral; LTF = lateral tibiofemoral; PF = patellofemoral; PTF = proximal tibiofibular.
Each compartment gets a 0-3 score for each of the four universal structural radiographic features in osteoarthritis: J = joint space width; O = osteophytes; C = cysts; S = sclerosis.
Scoring for nearly all features in all compartments had substantial to near-perfect inter-observer reliability (0.61–1.00) and can deliver structural (or "morphotype") heatmaps for easier visual interpretation of disease load and distribution.
The aim of COAKS was to introduce a system that could define structural patterns of disease in osteoarthritis for more accurate clinical trial and research study inclusion across all of the knee joint, as well as offering a more holistic evaluation of the joint morphotype for cross-sectional and cohort studies.

Stradview
State-of-the-art software for 3D CT visualisation and analysis
Our imaging analyses and visualisations are powered by Stradview, software developed by Prof. Graham Treece from the Cambridge University Engineering Department. Graham has collaborated with KNEE3D team members for over a decade, developing Stradview to provide state-of-the-art 3D DICOM imaging visualisation as well as cutting-edge bone and joint analysis techniques not just for the knee, but the whole body.


©Copyright. All rights reserved.
We need your consent to load the translations
We use a third-party service to translate the website content that may collect data about your activity. Please review the details in the privacy policy and accept the service to view the translations.